More and more, people are beginning their new year by making “challenges” instead of “resolutions.” The thinking behind challenges vs. resolutions is that people are more apt to accept a challenge.
Is Ohio up to the challenge? That is the question raised in an early-January 2024 study by The Road Information Program (TRIP). The report, despite Ohio’s and the nation’s influx of transportation and infrastructure funding, describes the potential obstacles facing the state’s road system. These obstacles, which if not overcome, could have ramifications to motorists, its economy and heavy/ highway construction industry.
“Keeping Ohio Mobile: Providing a Modern, Sustainable Transportation System in the Buckeye State” was released through an online event, January 9, where TRIP Policy & Research Director Rocky Moretti, TRIP Communications & Research Director Carolyn Bonifas Kelly and OCA President Chris Runyan introduced and described findings of the 20-plus page report to Ohio media. The report by the Washington, D.C.- based national research organization studies the challenges Ohio faces to accommodate future transportation growth, maintain the existing system and sustain adequate state funding due to increasing fuel-efficiency standards and electric vehicles.
Recent funding increases at both the state and federal levels have allowed Ohio to improve its current road system and make strides in improving safety and congestion through additional expansion projects. Those funding increases have come from the 2019 state per-gallon gas tax increase and the 2021 passage of the federal Infrastructure Investment & Jobs Act (IIJA). Ohio’s 10.5 cents per gallon gas tax increase (to 38.5 cents) and diesel fuel per-gallon tax increase of 19 cents (to 47 cents) is projected to provide an additional $5.4 billion in transportation funding from 2020-2030. The IIJA increased federal highway, bridge and transit funding in Ohio by approximately 30%.
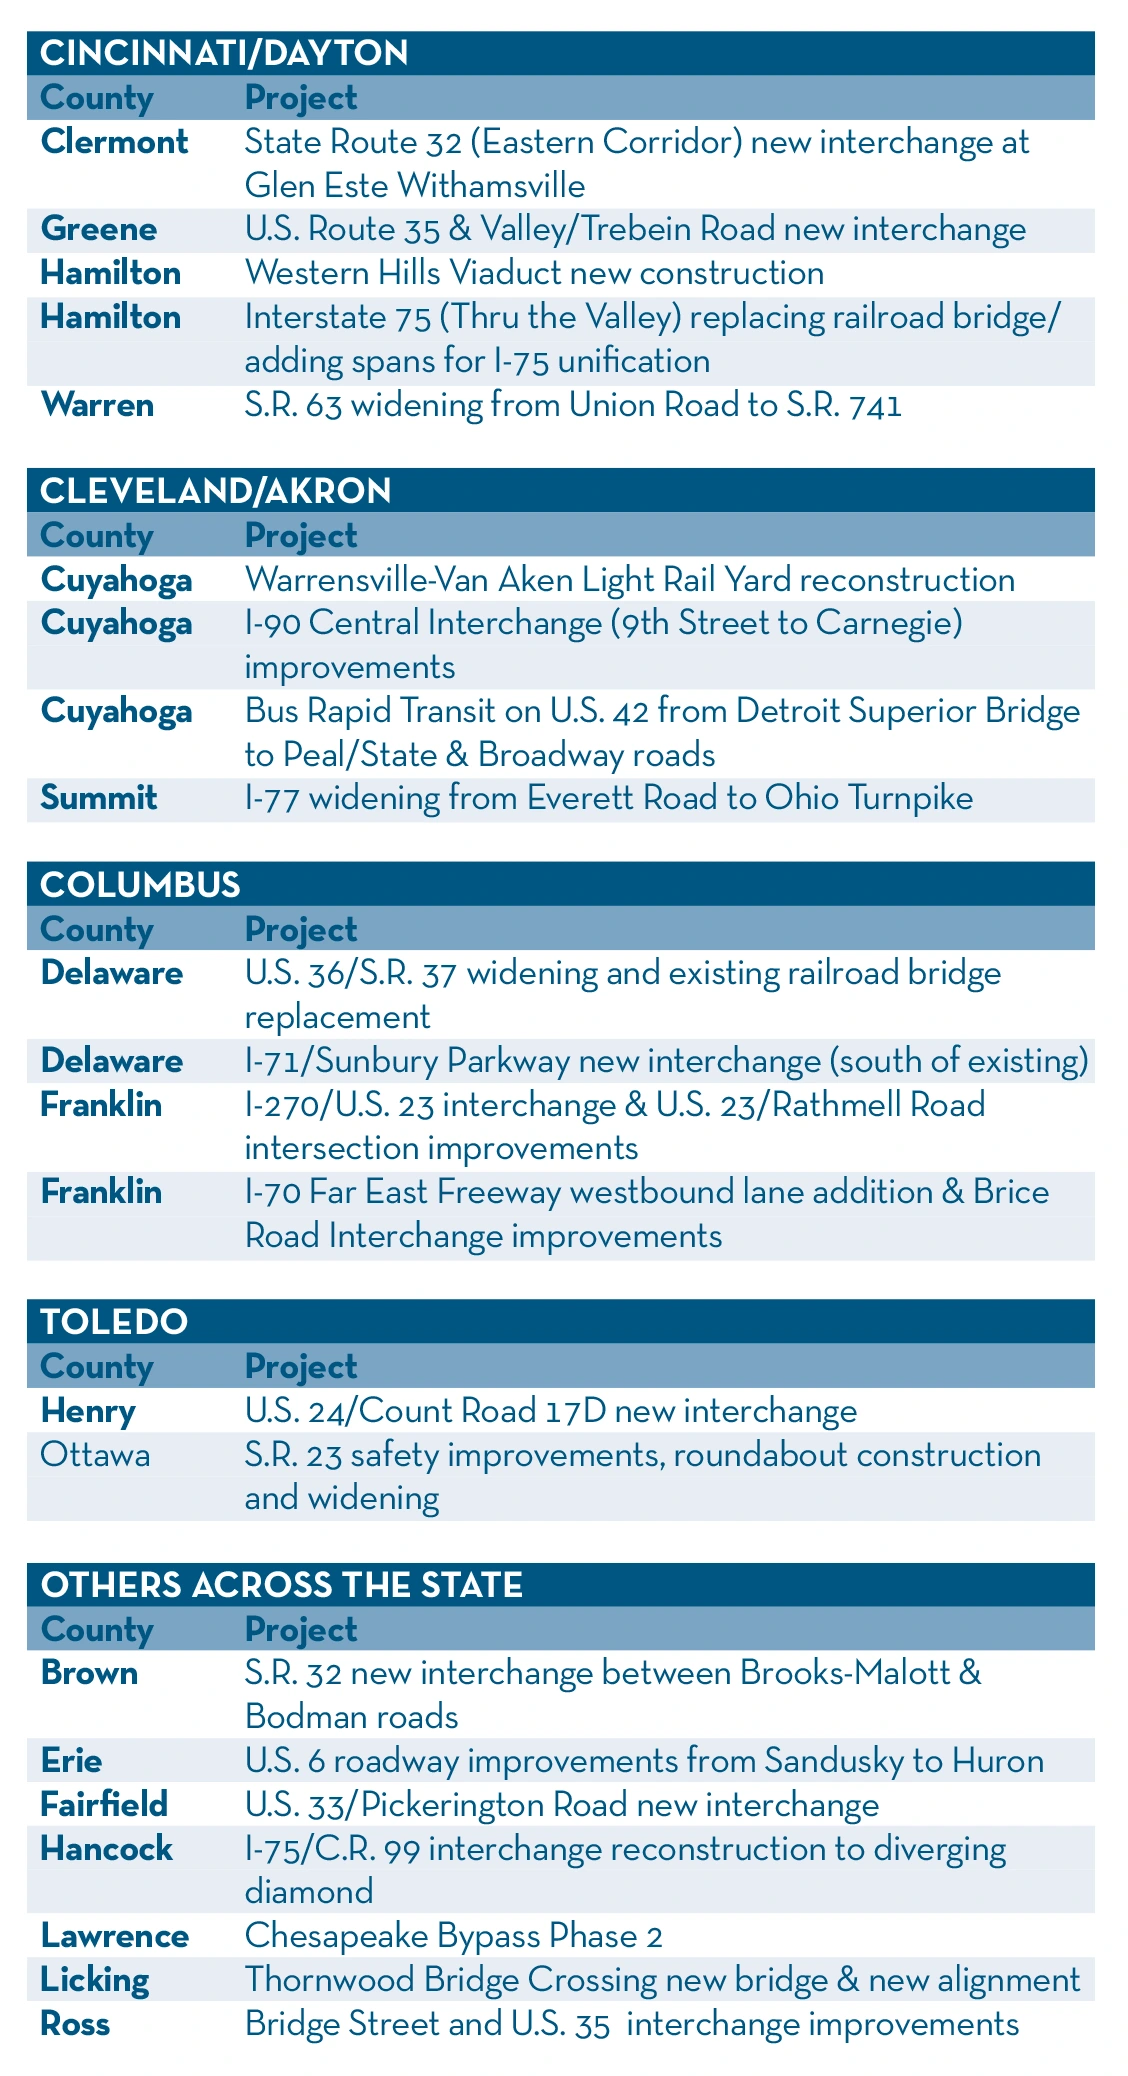
The additional funding for Ohio has propelled the Ohio Department of Transportation (ODOT) to move forward with major construction projects over the next four years (2023-2026). These projects, totaling $1.4 billion and located in 17 counties, feature new interchanges, viaducts, railroad bridges, intersections, widenings, improvements, roundabouts and diverging diamonds.
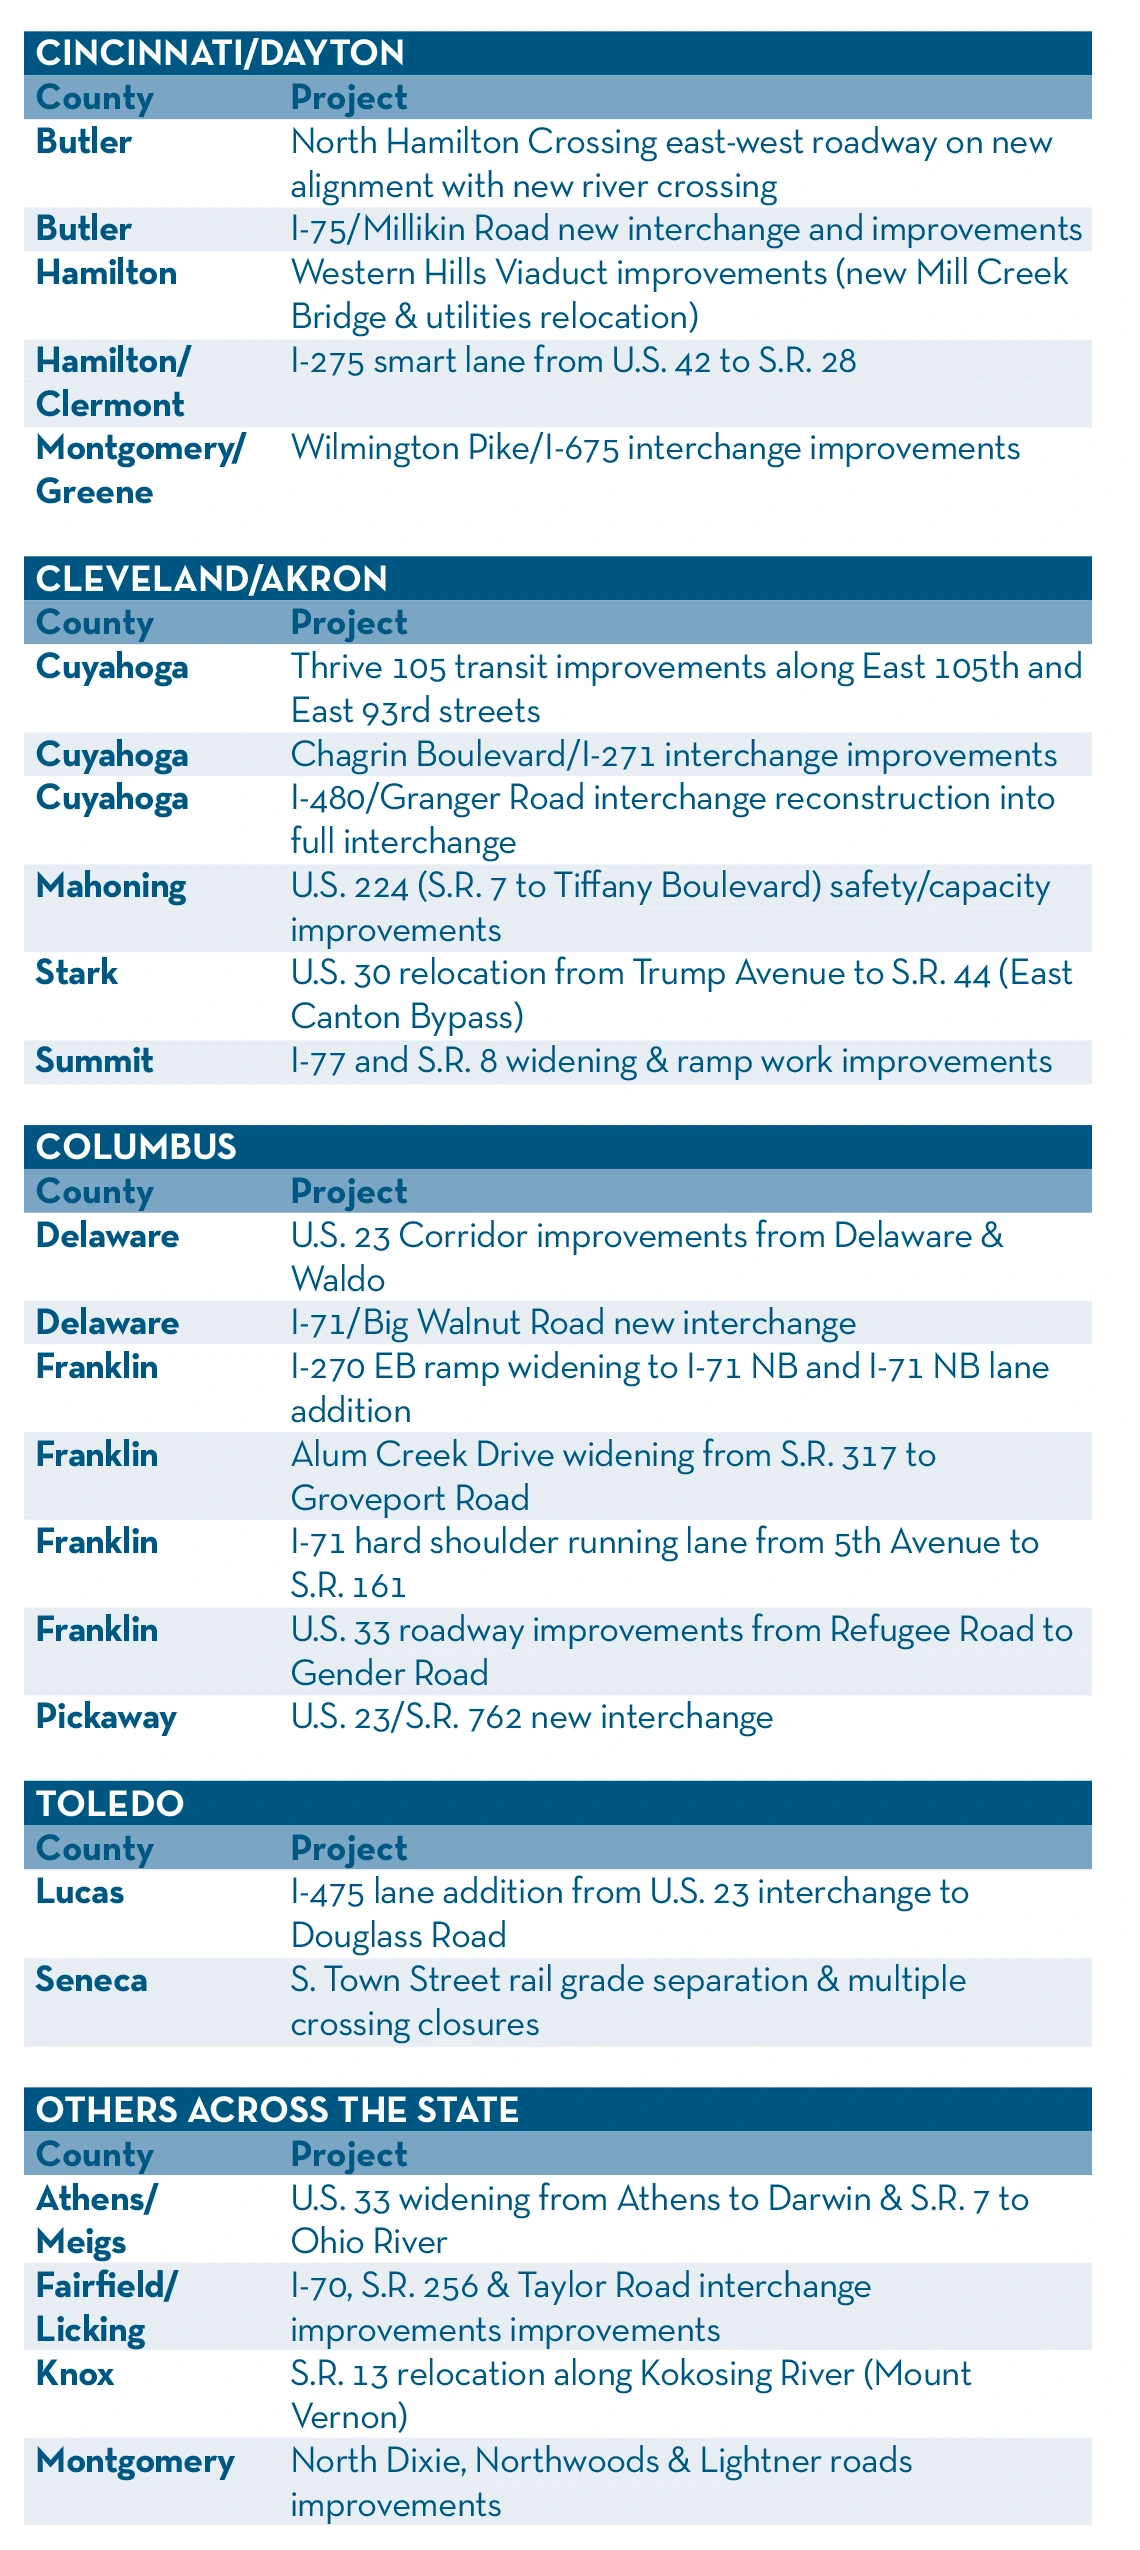
Along with the projects currently underway, Ohio’s increase in transportation funding has led ODOT to identify another 24 needed major projects. Although funding is available to complete the pre-construction phases of these projects – engineering and right-of-way acquisition – there is not enough to cover construction of the projects’ $1.6 billion price tag.
OHIO’S 2023-2026 MAJOR PROJECTS

PROJECTS ON-HOLD
SIGNIFICANT CHALLENGES
The TRIP report points to “significant challenges,” such as highway construction costs, vehicle efficiency standards and electric vehicle use, resulting in these needed projects to be placed on-hold.
“Revenue from the motor-fuel tax – a critical source of transportation funding – is likely to erode as a result of increasing vehicle fuel efficiency, the increasing use of electric vehicles and the impact of inflation,” the report states. Noting increased fuel efficiency in U.S. passenger vehicles from 20 mpg in 2010 to an expected 32 mpg by 2030, and the growth of electric vehicle purchases from 7% in 2023 to an expected 40% by 2030, have resulted in motorists purchasing less motor fuel. This decrease in motor fuel purchases is impacting tax revenue for transportation funding. Also impacting transportation construction are labor and materials costs, which increased 36% during 2022 and the first half of 2023 – meaning it’s costing more to complete projects. Compounding funding problems, Moretti noted that COVID resulted in a 34% decrease in vehicle miles traveled (VMT) on Ohio’s roads – which since 2019 has impacted transportation construction revenue. The good news is that in the first nine months of 2023, Ohio saw a 2% increase in vehicle travel from pre-COVID times.
The obstacles Ohio is facing in transportation funding toward new projects can also have an impact on the state’s regular maintenance program. And as the “Keeping Ohio Mobile” report points out, road and bridge conditions can have direct effects on motorists through increased vehicle operating costs (VOC).
ROAD & BRIDGE CONDITIONS
Statewide, TRIP reports that more than 30% of Ohio’s major roads are in poor or mediocre condition and nearly 40% of the state’s bridges are rated poor/structurally deficient (SD) or fair.
Roads
| Location | Poor | Mediocre | Fair | Good |
|---|---|---|---|---|
| Cincinnati | 33% | 22% | 15% | 30% |
| Cleveland-Akron | 35% | 22% | 14% | 29% |
| Columbus | 20% | 20% | 17% | 42% |
| Dayton | 38% | 27% | 13% | 33% |
| Toledo | 24% | 19% | 14% | 43% |
| Ohio-Statewide | 16% | 15% | 13% | 55% |
Bridges
| Location | Poor/SD-Number/Share | Fair-Number/Share | Good-Number/Share | Total-Number |
|---|---|---|---|---|
| Cincinnati | 101/5% | 879/40% | 1,243/56% | 2,223 |
| Cleveland-Akron | 137/7% | 806/44% | 909/49% | 1,852 |
| Columbus | 21/2% | 230/25% | 683/73% | 934 |
| Dayton | 28/3% | 287/29% | 664/68% | 979 |
| Toledo | 34/4% | 252/27% | 642/69% | 928 |
| Ohio-Statewide | 1,251/5% | 9,205/34% | 16,504/61% | 26,960 |
On a positive note, compared to neighboring states, Ohio’s bridge conditions rank favorably in fewest structures rated as “Poor/SD” and “Fair” and for highest percentage of bridges in “Good” condition.
| State | Poor/SD | Fair | Good | Total |
|---|---|---|---|---|
| Indiana | 5% | 53% | 41% | 19,381 |
| Kentucky | 7% | 67% | 26% | 14,493 |
| Michigan | 11% | 54% | 34% | 11,341 |
| Ohio | 5% | 34% | 61% | 26,960 |
| Pennsylvania | 13% | 53% | 34% | 23,257 |
| West-Virginia | 20% | 57% | 24% | 7,323 |
COST OF CONDITIONS
The additional cost to Ohio motorists driving on roads with potholes, rutting or rough surfaces can increase VOC – which includes accelerated depreciation of the vehicle, additional repairs, tire wear and higher fuel consumption. “When pavements are rougher for vehicles, it has to work that much harder. So, it’s burning more gasoline and causing more tire wear,” Moretti said. TRIP estimates the additional VOC for Ohio motorists resulting from deteriorated road conditions is $4.2 billion annually.
| Location | VOC |
|---|---|
| Cincinnati | $727 |
| Cleveland-Akron | $763 |
| Columbus | $534 |
| Dayton | $675 |
| Toledo | $567 |
| Ohio-Statewide | $524 |
Another cost because of road conditions is traffic congestion, which is having a major impact on both the state’s motorists/ commuters and economy. According to TRIP, “Congested roads, highways and bottlenecks choke commuting and commerce, and cost Ohio drivers $5 billion each year in the form of lost time and wasted fuel.”
Here is a look at how traffic congestion is impacting motorists/commuters in Ohio’s major metropolitan areas:
| Location | Annual Hours Lost to Congestion Driver | Annual Congestion Cost Per Driver | Gallons of Fuel Wasted Per Driver |
|---|---|---|---|
| Cincinnati | 48 | $1,157 | 24 |
| Cleveland-Akron | 40 | $938 | 21 |
| Columbus | 46 | $1,099 | 20 |
| Dayton | 30 | $627 | 12 |
| Toledo | 37 | $789 | 20 |
With the amount of VMT in Ohio rebounding to pre-COVID levels, Ohio motorists/commuters can look for congestion numbers (i.e., costs) to rise. “We’ve returned in Ohio back to the level of pre-COVID when Ohio has some very heavily traveled roads and highways,” said Moretti, “and we’re seeing that level of travel has returned.”
Traffic congestion not only slows motorists but also impacts businesses, shippers and manufacturers. “… Increasing congestion on Ohio’s major highways and roads hamper the state’s ability to support economic development and quality of life by reducing the reliability and efficiency of personal and commercial travel, including the transport of goods and services,” according to TRIP. The report warns that “increased levels of congestion can also reduce the attractiveness of a location when a company is considering expansion on deciding where to locate a new facility.”
According to “Keeping Ohio Mobile,” Ohio’s annual 1.1 billion tons of freight shipped on the state’s highway system can be adversely affected by road conditions. Adverse road conditions on the nation’s road system were a topic of a national study released by TRIP in December 2023.
See TRIP’s “America’s Rolling Warehouses: Opportunities & Challenges on the Nation’s Freight Delivery,” page 14.
“The amount of freight transported in Ohio and the rest of the U.S. is expected to increase significantly as a result of economic growth, changing business and retail models, increasing international trade and rapidly changing consumer expectations that place an emphasis on faster deliveries, often of smaller packages or payloads,” stated TRIP’s “Keeping Ohio Mobile” report. Ohio’s freight travel is currently hampered – and will be in the future, unless system improvements are made – by “the significant number of freight routes in the state that are constrained because they have inadequate load-carrying capacity to accommodate large trucks,” according to TRIP. The report listed Ohio’s top freight bottlenecks, as the Cincinnati area is home to six of the top 10 truck chokepoints in the state, with others located in Erie County, Springfield, Dayton and Mansfield.
“Keeping Ohio Mobile” also looked at an issue plaguing Ohio and the nation – Traffic Safety. The report noted that from 2018-2022, 6,080 people were killed in traffic crashes in Ohio – which averaged to more than 1,200 deaths annually. While the state’s 2022 traffic fatality rate of 1.16 deaths for every 100 million VMT was lower than the nation’s 1.35 average, Ohio saw an 11% increase in traffic fatalities from 2019-2022 despite VMT decreasing in the state over that same period by more than 2 billion miles (-2%).
Ohio Traffic Fatality & VMT
| Year | 2019 | 2020 | 2021 | 2022 | Change |
|---|---|---|---|---|---|
| Traffic-Fatalities | 1,153 | 1,230 | 1,351 | 1,278 | 11% |
| Fatalities/100M-VMT | 1.01 | 1.19 | 1.22 | 1.16 | 15% |
| VMT-(billions) | 114.7 | 103.1 | 112.9 | 112.6 | -2% |
According to TRIP, Ohio’s roadways can be made safer through improvements in vehicle safety; driver, pedestrian and bicyclist behavior; and roadway safety features. “Recognizing the rising number of crashes year-over-year, ODOT increased funding to target locations with high incidences of crashes. In the past year (2023) alone, 137 projects were completed that addressed locations where roadway geometrics, roadside hazards and traffic-control improvements were made.” According to TRIP, 121 additional project locations are targeted for safety improvements in Fiscal Year 2024.
CHALLENGE ACCEPTED?
While the overall conditions on Ohio’s surface transportation system, based on the TRIP report, are favorable, Moretti said challenges are ahead in the form of funding. “… Looking into the future, significant challenges can be found,” as he listed increases in highway construction costs, vehicle efficiency standards and use of electric vehicles – which affect motorfuel tax revenue.
“The state will need to identify a reliable, long-term source of transportation funding in order to provide additional improvements to major highways and bridges, accommodate the anticipated significant growth in freight, and to support Ohio’s economy,” said TRIP Executive Director Dave Kearby.
Runyan said though it is “gratifying to see what is being done with revenue increases” – as he referenced the DeWine Administration and IIJA – he added that Ohio must remain resolute in ensuring stable funding continues. “To keep these mobility needs met, it is vital that viable funding resources are in-place to meet the needs of a society that is ever-growing and ever changing. Just as with any fixed asset, with use comes degradation. With new needs placed upon the system, expansion is necessary.”
And in that lies the challenge.