As “The Heart of it All,” Ohio’s geographic location allows the state’s residents and businesses to be within 60% of the U.S. population in a day’s drive. However, depending on what surface transportation component you’re looking at, that can be a boon or a bust.
While Ohio is conveniently located within 500 miles – which is considered an average day’s drive – from 21 other states, the current U.S. Department of Transportation’s National Bridge Inventory (NBI) database finds travelers from the Buckeye State are a 10-hour drive from crossing into states with 64% of the nation’s structurally deficient bridges – or structures in need of repair or replacement.
In August, the American Road & Transportation Builders Association (ARTBA) released a comprehensive analysis of the latest NBI statistics. This year marks the tenth that the ARTBA Bridge Report has provided “a snapshot in time of our nation’s bridge conditions.”
When asked about the nation’s total of more than 42,400 bridges considered structurally deficient, ARTBA Chief Economist Dr. Alison Premo Black, who has led the development of the group’s Bridge Report, said, “There is a lot of work that needs to be done” when it comes to improving the conditions of the nation’s bridge inventory. Though she quickly added, “Things have gotten better.
“We’ve been doing this report for a number of years, and even though things get better bit by bit, it’s a process that takes time and there is still a lot that needs to be done. This is where I think this report helps provide that snapshot in time.”
NBI’s 2023 database from early July shows more than 16,100 fewer structurally deficient bridges in the U.S. compared to 2015 data, which reported nearly 58,500 structurally deficient bridges. For Ohio, in a comparison of NBI statistics from 2015 and 2023, the state has 642 (34%) fewer structurally deficient bridges on its system today than eight years ago. There is a disclaimer, however, regarding the reported bridge conditions, as state and local governments are continually in the process of making needed repairs and it may take time for those improvements to appear in NBI’s statistics. The 2023 ARTBA Bridge Report shows Ohio has 1,231 bridges deemed structurally deficient.
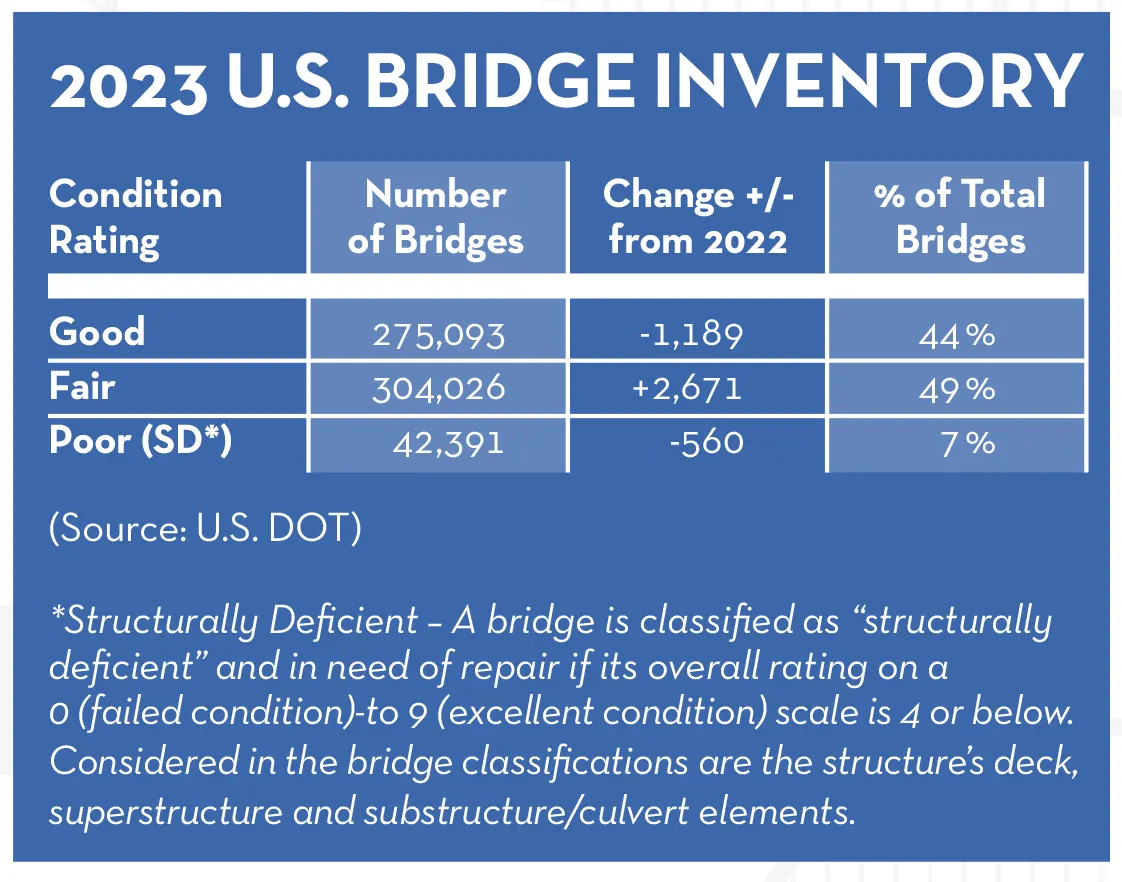
Since 2017, the Federal Highway Administration (FHWA) no longer uses the phrase “structurally deficient.” However, for the ARTBA report, a structurally deficient bridge refers to a structure considered to have a “poor” standard. According to Ohio Department of Transportation (ODOT) Structural Engineering Office Administrator Sean Meddles, P.E., the FHWA defines condition ratings by “good,” “fair” and “poor.” Meddles said the FHWA bridge condition standards correlate to Ohio’s 0-9 scale as: good=7,8,9; fair=5&6; and poor=4 or less.
Continual bridge improvements are evident in the fluctuation of the NBI database and ARTBA analysis. According to ARTBA, “Over the last five years, the share of bridges in fair condition has continued to grow as the share of structures classified in ‘poor’ or ‘good’ condition declined … In 2023, nearly half of all bridges in the U.S. (48.9%) are in fair condition.”
Based on 2023’s declining amount of U.S. bridges in poor condition, the NBI remains disconcerting nonetheless, which ARTBA’s Bridge Report points out:
- More than 222,000 bridge spans (36%) in the U.S. need major repair, including 76,600 bridges that should be replaced.
- Of the bridges needing repair, nearly 42,400 are rated in poor condition and classified as structurally deficient. These structurally deficient structures are crossed/traveled by motorists 167 million times a day.
- U.S. bridges in poor condition declined by 560 compared to 2022. At the current pace, it would take nearly 75 years to repair them all.
According to ARTBA, “placed end-to-end, these structures (in need of repair), span over 6,100 miles – and would take over 110 hours to cross at a speed of 55 mph.” The nation’s mileage of structurally deficient bridges would circle Ohio’s nearly 1,120- mile border 5 1/2 times.
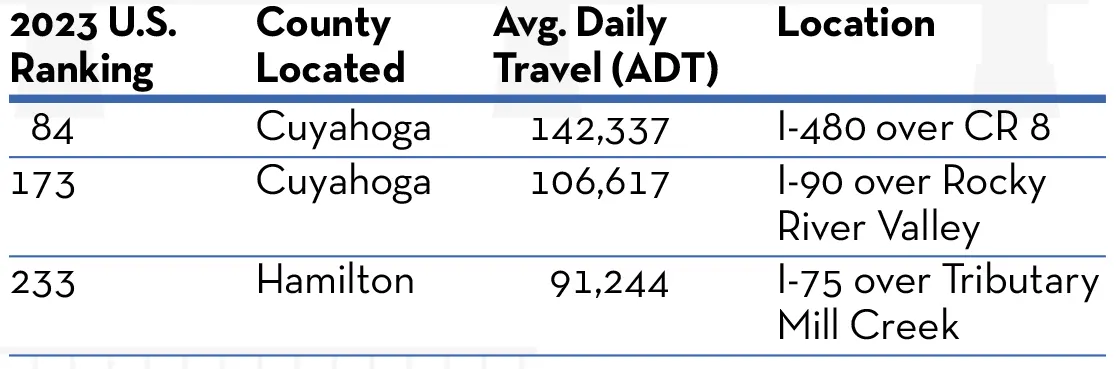
ARTBA listed the nation’s most-traveled structurally deficient bridges in 2023. While 31 of the nation’s top 50 heavily traveled bridges in need of repair are in California, 22 bridges among the nation’s 250 most-traveled structurally deficient structures are in Ohio and contiguous states. Here are the three Ohio structurally deficient bridges among the nation’s 250-most traveled:
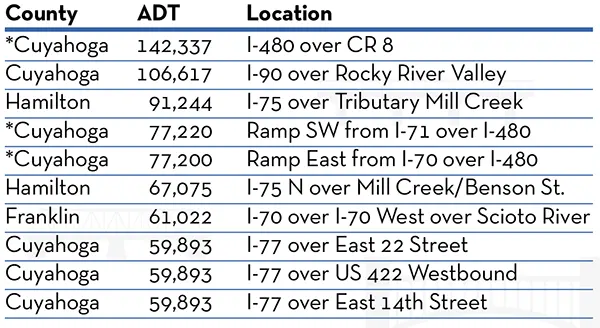
Here is a look at Ohio’s 10 most-traveled structurally deficient bridges:
SURROUNDED BY SD STRUCTURES
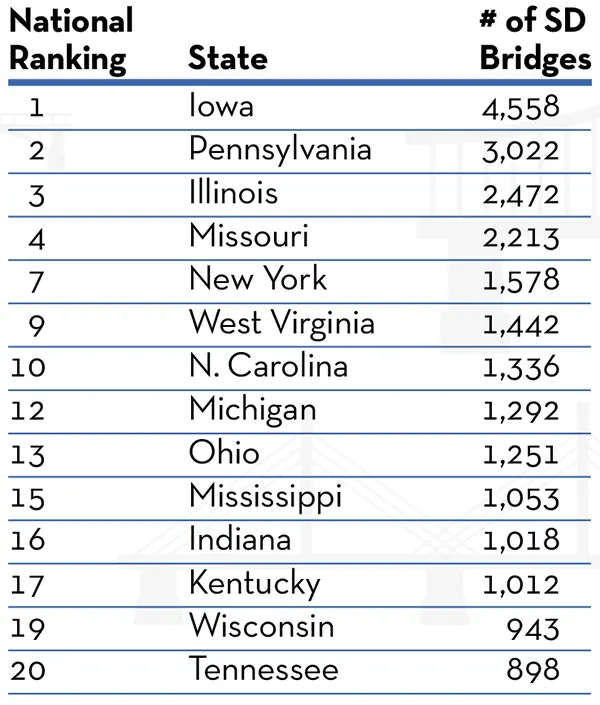
Within Ohio and a day’s drive of the Buckeye State, motorists will encounter several of the more than 27,300 structurally deficient bridges found in the 22-state region. Within 500 miles of Ohio’s borders are seven of the nation’s top 10 – and 14 of the leading 20 – states for structurally deficient bridges.
Premo Black is quick to remind that while structurally deficient bridges are not unsafe, they could change traffic patterns. “The bridges are not unsafe. They are routinely inspected. But at times, bridge conditions can get to a point where a bridge may be closed or posted for load – which means there are weight restrictions on a structure,” she said. “So, if you are a commercial truck, or depending on the freight that you may be carrying, you may have to divert or take a detour or make some sort of alternative plans if you are encountering these bridges that are posted for loads … Certainly it is something to be aware of.”
TOP 20 RANKINGS
While a Top 20 NCAA football ranking brings enthusiasm, inclusion in NBI’s Top 20 for structurally deficient bridges has a different connotation. Along with Ohio, here are the states within a day’s drive that are leading the nation for the most structurally deficient bridges:
SPAN OF BRIDGES
While it has less than half the number of Texas’ 56,313 bridges, Ohio’s 26,960 structures is the second-most of any state according to NBI statistics. Illinois has the third-most bridges with 26,873. According to the NBI, Ohio has 3,183 structures, or 12% of its bridges, in need of some sort of repair, which ranges from deck rehabilitation to widening to bridge replacement.
Ohio’s 12% of bridges in need of repair is well under the nation’s 36%, which Premo Black said provides insight on how well the Buckeye State is doing with the upkeep of its structures. She added that it’s even more an indication of the strength of Ohio’s program that only 4.6% of its nearly 27,000 bridges in the NBI are structurally deficient – which is tied for 14th-lowest percentage of a state’s total bridge inventory in the nation. “With that large of a bridge network there are challenges … the fact that Ohio is doing so well and ranks so high in that list is a good thing as far as the percentage of bridges in ‘poor’ conditions,” she said. “It is very common that we see a lot of these structures that do need these repairs are on local roads networks, and it can be more challenging to raise money at the local level. Although I know that Ohio has a lot of local ballot initiatives to help fund some of those repairs.”
ODOT’s Meddles provided statistics validating Premo Black’s praise for the upkeep and management of Ohio’s bridges. From 2013-2022, Ohio constructed nearly 4,800 new bridges (938 on ODOT system, 3,854 on local system) and performed major rehabilitation on another nearly 1,540 structures (382 ODOT, 1,151 local). “ODOT programs bridge projects across a six-year forecast,” stated Meddles, who added that this past July, 99.02% of Ohio’s bridges are in fair condition or better. The state’s structures with condition rankinggs of 6 and under are inspected at 12-month intervals.
![]() Meddles clarified that Ohio’s definition of a bridge differs than that of the federal definition. “The ARTBA report is based on the federal definition of a bridge, which spans 20 feet or more. According to the Ohio Revised Code (ORC) 5501.47(B)(1)(c), a bridge is defined as spanning 10 feet or more. This is important to note,” Meddles stated, “as owners of Ohio bridges have a larger inventory to maintain than required under the federal requirements. ODOT programs bridge projects based on the Ohio bridge definition.” When considering Ohio’s “10 feet or more” definition of a bridge, there were a total of 42,996 bridges in the state in 2022 – which is nearly 60% more than listed in the NBI’s bridge inventory for Ohio.
Meddles clarified that Ohio’s definition of a bridge differs than that of the federal definition. “The ARTBA report is based on the federal definition of a bridge, which spans 20 feet or more. According to the Ohio Revised Code (ORC) 5501.47(B)(1)(c), a bridge is defined as spanning 10 feet or more. This is important to note,” Meddles stated, “as owners of Ohio bridges have a larger inventory to maintain than required under the federal requirements. ODOT programs bridge projects based on the Ohio bridge definition.” When considering Ohio’s “10 feet or more” definition of a bridge, there were a total of 42,996 bridges in the state in 2022 – which is nearly 60% more than listed in the NBI’s bridge inventory for Ohio.
OHIO’S PROPOSED BRIDGE WORK
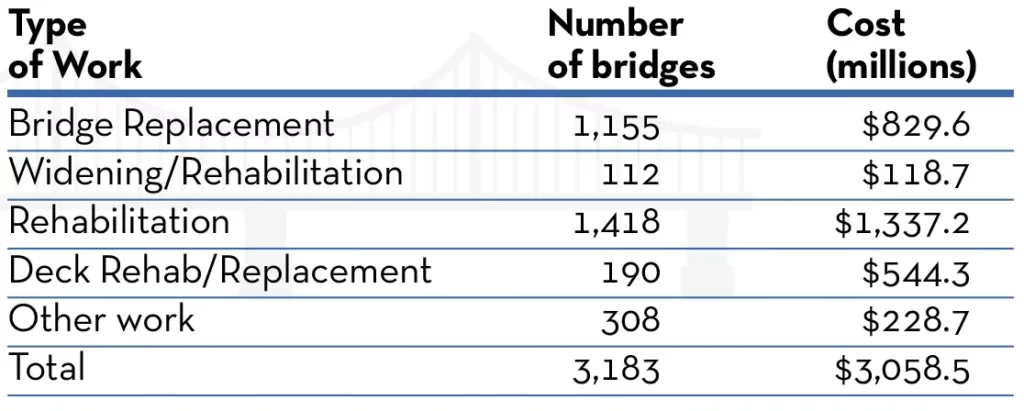
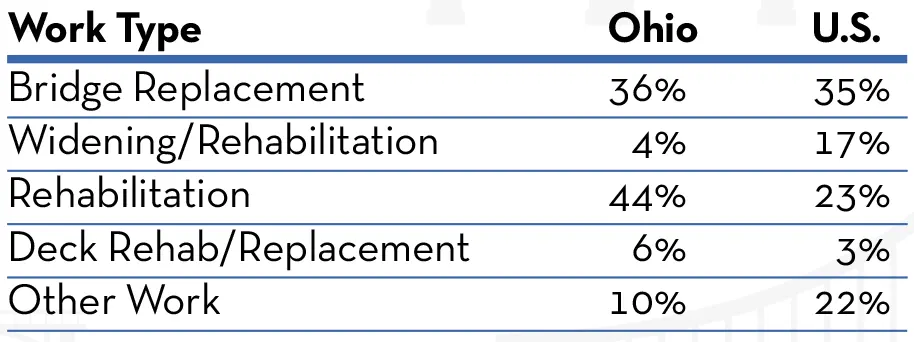
Ohio’s 36% of proposed bridge work going toward bridge replacement mirrors the nation’s proposed 35% of bridge work going toward structure replacement.
BRIDGE WORK AHEAD
Here is a comparison between Ohio and the nation for percentage of bridge repair proposed by work type:
Of the nearly 3,200 Ohio bridges in need of repair, 1,251 (39%) are deemed structurally deficient, and are located throughout the state’s road system. Ohio’s structurally deficient structures are found on both the state’s rural (961, 77%) and urban (290, 23%) systems, and range from being located on larger routes such as interstates, freeway/ expressways and other principal arterials (84 bridges total, 7%) to being on local systems (733, 59%).
The 2023 NBI shows Ohio’s bridge inventory has steadily improved in recent years, as the number of structurally deficient structures in the state has declined by 206 bridges since NBI’s 2019 report. Meddles said to look for Ohio’s bridge inventory to continue to improve, as projects to improve 330 of the state’s structures currently deemed “poor” are planned to be awarded over the next three years (2024-2026). Those 330 projects include 152 county, 134 ODOT and 36 municipal bridges. According to Meddles, over the next six years (2024- 2029) nearly 200 projects will be let for improvements to ODOT bridges in poor condition.
FEDERAL FUNDING WILL HELP BRIDGE THE GAP
With added federal funding available beyond what is earmarked in the Infrastructure Investment & Jobs Act (IIJA) for bridge improvements, look for more than the $260 billion and $3.05 billion in IIJA’s proposed bridge repair nationally and in Ohio, respectively, as additional federal funding becomes available for bridge improvements.
It was announced in January 2022 that the U.S. DOT would disburse more than $27.5 billion of IIJA funding to states for bridge repair over the next five years. In addition, there is an IIJA-created discretionary bridge program through the U.S. DOT providing $12.5 billion for projects awarded over the next three years. ARTBA also noted in its Bridge Report from 2022 that state DOTs also have funding through federal formula highway fund programs – such as the National Highway Performance and Surface Transportation Block Grant programs.
In its 2023 report, ARTBA reported that states have access to $10.6 billion in IIJA bridge formula funds – with another $15.9 billion being made available through 2026. “Over the life of the IIJA,” according to ARTBA, “Ohio will receive a total of $521.5 million in bridge formula funds, which will help make needed repairs.”
However, as of June 30 of this year, states had committed just 30% of available federal funding for bridge improvements. According to ARTBA, Ohio was one of 31 states having committed less than one-third of its available funding. “Ohio currently has access to $208.6 million of that ($521.5 million) total and has committed $24.6 million towards 37 projects as of June 2023,” according to the ARTBA Bridge Report.
Premo Black is confident the full amount of the federal bridge funding will be utilized by the states – it will just take time. “I think one of the things to keep in mind is that states received a substantial increase in just that core formula program that they had to commit within the first year of the IIJA. So, I think you saw a lot of focus on just getting those dollars committed, where with the bridge funds there is a little bit of flexibility where states aren’t going to lose that money after the first fiscal year … I am confident it will all be used, and we’re expecting to see those (bridge funding) commitments pick up over the next year.”
Speaking of next year and beyond, Premo Black, who also authors ARTBA’s annual “U.S. Transportation Construction Market Forecast,” predicts the nation’s bridge system improvements to continue. “I would expect that we would see that number, that share in numbers of bridges in poor condition, to go down even further. That improvement will accelerate,” she said. “And I think the other thing to keep an eye on is that hopefully we will see the number of bridges in good condition start to climb as well.”
Asked if the nation’s bridges are improving overall, Premo Black answered: “Very slowly. Bit by bit. But we are moving in the right direction.”
The full 2023 ARTBA Bridge Report is available at https://artbabridgereport.org/. An in-depth analysis of Ohio’s bridges by ARTBA is available at https://artbabridgereport.org/state/profile/OH.